
This post may contain affiliate links, which means I’ll receive a commission if you purchase through my links, at no extra cost to you. Please read full disclosure for more information.
Immediately following the COVID-19 pandemic that hit the world in 2019, nearly half of weddings in 2020 were suspended. Whether they were canceled, rescheduled or delayed until further notice, like many other things, a major standstill happened to the wedding industry.
The further we get from 2019, the more wedding statistics improve towards what can be seen as a recovery and or a new normal.
Since it is difficult to separate wedding videography statistics from that of weddings in general, we’ll discuss all of these pertinent statistics but broken down into general categories.
Cost of Weddings
#1. The expectation for 2023 is that weddings will cost an average of $24,900 for a projected 2.24 million weddings. (The Wedding Report)
#2. In 2021, the national average cost of a wedding was about $28,000 but if the price of the engagement ring was included, the average cost was $34,000. (The Knot 2021 Real Weddings Study)
#3. The average cost of weddings has increased by 25% from 2020 to 2021, from $20,286 to $27,063. (Wedding Report)
Categories of Spent Budget according to the Wedding Report
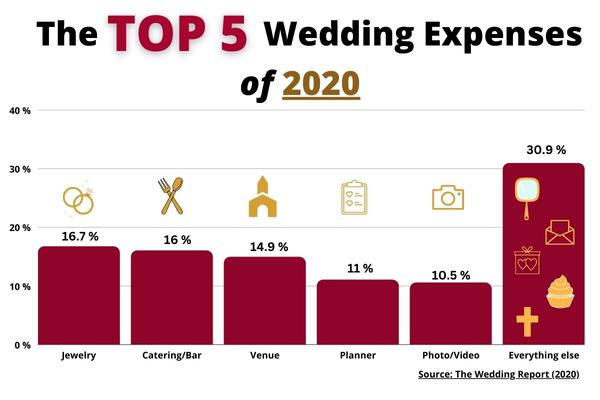
#4. In 2020, only 10.5% of what couples spent on their wedding day was attributed to the category of photo and video.
#5. Couples spent 16.7% of their wedding budget on jewelry and 16.0% on event catering and bar service.
#6. The 5 top categories of expenses in average spending are listed from highest to lowest:
- Jewelry 16.7%
- Event Catering & Bar Service 16%
- Event Location/Venue 14.9%
- Planner/Coordinator 11%
- Photography & Video 10.5%
#7. The lowest 5 categories of expenses in average spending are listed from lowest to highest:
- Beauty & Spa 0.5%
- Bakery 0.9%
- Ceremony Officiator 0.9%
- Invitations 1.6%
- Gifts & Favors 1.7%

Vendors Hired
#8. According to the Knot in a 2021 survey, last year, the top 9 vendors hired did NOT include a wedding videographer. (The Knot)
- Wedding Dress 93%
- Venue 88%
- Photography 87%
- Groom’s Attire 87%
- Hired a Caterer 85%
- Cake 81%
- Hair + Makeup 74%
- DJ 67%
- Florist 68%
#9. $1800 is the average cost of a wedding dress for brides in 2021, whereas the groom’s attire was about $270. (The Knot)
Wedding Videography Statistics
#10. Back in 2015 (which is the most recent year that I can find), only 1 in 3 brides hired a professional wedding videographer to capture their big day and preserve their special moments. (Forbes)
The Business Side of Wedding Videography
#11. Wedding videographers spend an average of 9 hours on their feet during weddings. (The Knot)
#12. Two thirds (2/3) of wedding videographers are offering aerial drone services as part of their packages. (The Knot)

Bride’s Regrets
#13. Arguably, one of the bride’s biggest regrets is not hiring a wedding videographer.
While it’s difficult finding an exact percentage to quote, it is clear that there are mixed feelings on if a bride and groom should hire a wedding videographer.
In a WeddingWire forum post in 2019, a bride posted a question asking if anyone had regrets with not hiring a wedding videographer. (Wedding Wire)
Out of the 29 comments, the breakdown is as follows:
- Stated no regrets: 6
- Videography was a MUST: 6
- Had regrets for not booking a videographer: 3
- Encouraged to get wedding videography: 4
- Did not give a clear answer: 7
The numbers are skewed because several comments were posted by the same individual and/or the same individual’s responses fell into multiple categories.
*Of note, one of the comments was posted by a wedding photographer who was also a bride-to-be who stated she “always” recommends her wedding couples hire a wedding videographer since there are unique moments of the special day that are not captured adequately by photo only.
#14. A survey conducted by WEVA showed 98% of newlyweds recommends brides have wedding videography. (WEVA)
Wedding Videography costs vary greatly
#15. The cost of wedding videography varies greatly and is affected by a variety of factors including the length of time the videographer is filming at the wedding, the cost of equipment used, the quality of film produced, the types of film produced and more.
The “average cost” of a wedding videographer can be deceiving with higher quality films easily costing more than the quoted average cost. (Wedding Wire)
A film by Ray Roman, for example, considered one of the top 3 wedding cinematographers in the world is in high demand and extremely expensive given the quality of the film produced.
#16. According to the Wedding Report, couples spent an average of $1712 on a wedding videographer in 2021. (The Wedding Report)
#17. The average price of wedding videography for 2022 is $1900 based on a study from 2021. (The Knot)
Fun Facts
Weddings in General
#18. 2.6 million weddings are estimated to take place this year of 2022 which is increased from 2.2 million compared to 2019. (The New York Times)
#19. The market size of the Wedding Services industry is $61.9 billion for 2022 in the United States. (IBIS World)
#20. The market size of the Wedding Services industry is expected to increase by 3.8% in 2022 but has declined overall since 2017 by an average of 6.2%. (IBIS World)
#21. High competition and low barriers to entry are the primary factors negatively affecting the growth of the Wedding Services industry in the United States. (IBIS World)
#22. The average length of a wedding ceremony in the United States is about 20-30 minutes. (Brides)
#23. The average wedding size reached an all-time high of 153 in 2007 but for the United States, decreased to an average guest count of 110 following the pandemic, in 2021. (The Knot)
Micro Weddings
#24. Only about 10% of all weddings fall into the category of elopements or micro weddings. Micro weddings are considered weddings with up to 50 guests. (The Knot)
Photography in General
#25. Globally, the estimated market size for photography services is projected to reach USD of 60.10 billion by 2027. As of 2021, it was estimated at USD of 37.65 billion. (Research and Markets)
#26. The market size has declined in the US. The decline has been faster than Professional, Scientific and Technical Services. (IBIS World)
#27. In regards to market growth, the key market driver for the photography industry in general is the growing number of people employed in photography. (Fortune Business Insights)
#28. The key market restraint is the increasing number of personally owned technological devices. (Fortune Business Insights)
WEDDING PHOTOGRAPHY INDUSTRY
#29. Wedding photography is dominated by women compared to men, 59.7% to 40.3%. (Zippia)
#30. 71.4% of wedding photographers are white. (Zippia)

#31. The most popular states for the wedding photography market are New York and Illinois. (Zippia)
#32. Wedding photography is segmented into traditional wedding photography, artistic wedding photography, and natural wedding photography amongst others. (Zippia)
WEDDING SEASON STATISTICS
#33. 80% of weddings take place between May and October. (Wedding Wire)
#34. The most popular month for a wedding date is October. (Wedding Wire)
#35. The winter months are considered the least popular months to get married, that being December, January, and February. (Wedding Wire)
WEDDING COUPLE DEMOGRAPHIC STATISTICS
#36. In the United States, the median age for first-time brides for women is 28 years old (years 2015-2019) which is increased from 26.3 years of age (years 2006-2010). (Population Reference Bureau)
#37. For men in this same time frame, the median age for the first marriage is 29.9 years, increased from 28.1. (Population Reference Bureau)
#38. Within Gen Z, more than 1 in 5 couples marry someone of a different background. (The Knot)
#39. The average length of the engagement period for wedding couples is 14 months if their wedding is not postponed. (The Knot)
#40. 51% of women and 47% of men perceive personal style as their highest priority when it comes to wedding planning. (Brides)
WEDDING INDUSTRY SUB-GROUPS
#41. Wedding planning services are included in the broad category of “event planners” and this category is projected to grow 18% from 2021 to 2031, which is a must faster average than all other occupations. (Bureau of Labor Statistics)
#42. In 2019, the wedding and wedding reception venue were the highest cost of the wedding budget. (Business Insider, The Knot)
#43. In recent reports (as of 2021), the most popular type of wedding planner hired has been full-service planners and day-of-coordinators. (The Knot)
#44. Half of a couple’s wedding budget is attributed to the costs of the wedding venue and reception, catering and rentals. (Wedding Wire)
#45. 69% of wedding reception venues will include amenities like tables and chairs. (Wedding Wire)
DESTINATION WEDDINGS
#46. In 2021, the largest region in the destination market for weddings was North America. (Research and Markets)
SOCIAL MEDIA & WEDDINGS
#47. 83% of wedding planning is now taking place online. (Research and Markets)
#48. When it comes to social media, over 50% of wedding couples are using a hashtag on social media. (Research and Markets)
#49. More than 60% of couples create their online wedding website. (Research and Markets)
#50. 80% of millennials plan their wedding online and 39% use their mobile device to do so. (Wedding Wire)
#51. In recent years since 2016, brides are increasing their use of social media in regards to even the little things about their wedding planning, from sharing news of their engagement, the journey of their wedding planning, connecting with vendors and even their honeymoon experiences after their nuptials. (The Knot Social Media Survey 2016)
#52. Survey participants from The Knot Social Media Survey in 2016 indicate the top 3 social media platforms used for their wedding planning are Pinterest (89%), Instagram (38%) and Facebook (38%).

#53. However, about 74% of couples say they want to be disconnected from social media on their wedding day, leaving social media posts of their wedding to their guests. (The Knot Social Media Survey 2016)
Texas Weddings
#54. The average cost of a wedding in Texas is about $30,200 in 2019. (The Knot)
SAN ANTONIO WEDDINGS
#55. For San Antonio and the New Braunfels Metropolitan area, 13,098 weddings occurred in 2021. This area ranks 26 out of 933 Metropolitan areas when it comes to the number of weddings. (Wedding Report)
#56. In regards to average wedding costs, for this same area in 2021, the average cost was $29,196, ranging 110 out of 933 Metropolitan areas. (Wedding Report)
#57. The average cost of wedding videography in San Antonio, Texas is between $1000-$1613, however the upper range can be as high as $2475 and more. (Wedding Wire)
Takeaway Points on Wedding Statistics
When it comes to cost of weddings and the breakdown costs of wedding, those statistics vary widely across local and state lines.
Social media use is increasing in both those engage and those involved in the wedding industry. Using social media platforms such as Instagram is an increasing way for wedding industry services to attract interest and increase bookings.
One of the largest parts of the wedding budget is usually attributed to the wedding venue and reception location. To minimize costs, try to book a wedding venue with reception hall who also provides additional amenities including linens, tableware, setup, shutdown and if possible, more.
The costs of wedding videography vary greatly with multiple factors including location, wedding film packages and clients’ preferences. Recent detailed statistics regarding brides’ opinions on wedding films are difficult to find and quantify. Conclusions are based on generalizations from the data found and mentioned above.
Wedding services continue to be a thriving industry in the business sector despite the effects from COVID19 back in 2019.
The Knot and Wedding Wire are the top website sources of information when it comes to wedding planning for couples.

Hello there! This is such a timely article considering my cousin is about to get married this fall. I like the idea of involving nature in our wedding video which has been quite popular lately. Nevertheless, I believe she must reach out to a videographer to document the ceremony properly.
Hey Sam! Thank you for your feedback. I’m glad this was helpful. Yes, I do believe having an experienced videographer involved is essential to obtain the best footage of the wedding day. I wish your cousin the best in their endeavors!